Often
we need to know the general shape and location of a graph. In such
cases, a sketch graph is drawn instead of plotting a number of
points to obtain the graph.
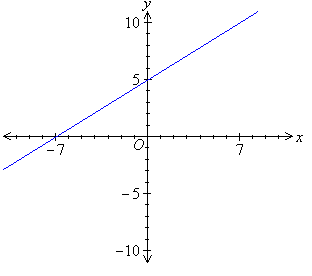
Two points are needed to obtain a straight line graph. It is
simpler to find the points of intersection of the graph with the
axes. These points are called the x- and y-
intercepts.
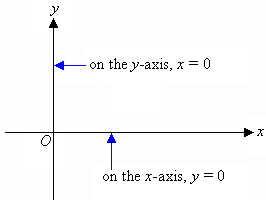
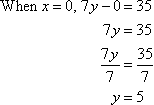
x-intercept:
The y-coordinate of any point on the x-axis is 0.
Therefore to find the x-intercept we put y = 0 in the equation of the line
and solve it for x.
y-intercept:
The x-coordinate of any point on the y-axis is 0.
Therefore to find the y-intercept we put x = 0 in the equation of the line and solve it for y.
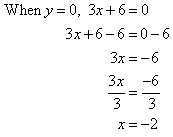
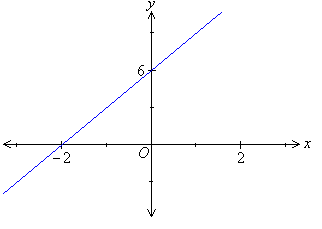
Example 5
Sketch the graph of y = 3x + 6.
Solution:
y = 3x + 6
x-intercept:
y-intercept:
Note:
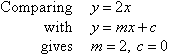
We often represent the gradient and the y-intercept of the
straight line by m and c respectively.
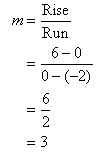
In the previous example:
From the ongoing discussion we can infer that y = 3x + 6
is a straight line with a gradient of 3 and y-intercept of 6.
In general:
A linear function of the form
y = mx + c
represents the equation of a straight line with a gradient of m and y-intercept of c.
In the example under consideration, the gradient of the straight line
is positive. So, the straight line slopes upward as the value of x increases.
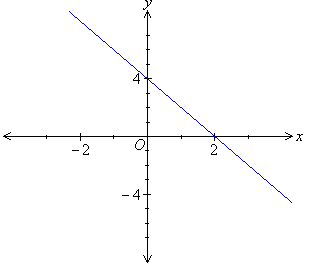
Example 6
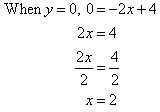
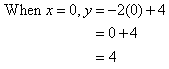
Sketch the graph of y = –2x + 4.
Solution:
y = –2x + 4
x-intercept:
y-intercept:
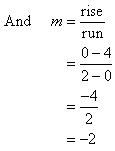
Note:
From the ongoing discussion we find that the linear function y = –2x + 4 represents the equation of a straight line with a
gradient of –2 and y-intercept of 4.
In the example under consideration, the gradient of the straight line
is negative. So, the straight line slopes downward as the value of x increases.
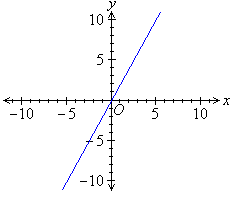
Example 7
Sketch the graph of y = 2x.
Solution:
y = 2x
x-intercept:
y-intercept:
When x = 0, y = 0.
As both the x- and y- intercepts are (0, 0), another
point is needed.
We find when x = 5, y = 10. So, (5, 10) is an
example of another point that can be used to form the straight line graph.
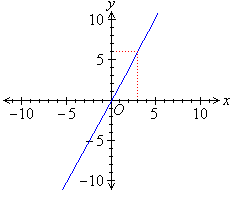
Alternative technique:
Use the gradient-intercept method:
So, the straight line passes through (0, 0). Use this point to
draw a line of slope 2 (i.e. go across 3 units and up 6 units).
Note:
It is simpler to find the run and rise if we start from the y-intercept.