We use tree diagrams, Venn diagrams and graphs to represent sample
spaces.
Tree Diagrams
A tree diagram enables us to find the elements of the sample
space.
E.g. If an experiment's trial involves tossing a fair coin, then
the possible outcomes are head and tail. This information can be
depicted in the following tree diagram.
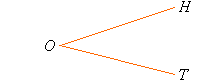
Clearly, S = {H, T}
Recall that each element of the sample
space is called a sample
point. So, the sample points are H and T.
Venn Diagrams
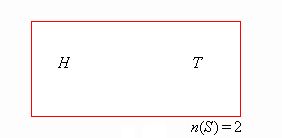
The sample space and an event may be represented on a Venn diagram.
For the experiment of tossing a fair coin, the possible outcomes are
head and tail. So, the following Venn diagram represents the
experiment's sample space.
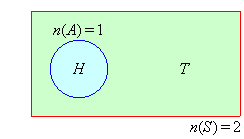
If A is the event 'a head falls', then we can use the following
Venn diagram to represent it.
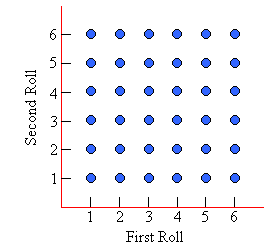
Graphical Representation
If an experiment's trial involves rolling a die twice, then there are
36 elements in the sample space as shown below.
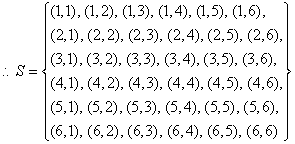
As the tree diagram will be very large, the following simple graphical
representation can be used instead.
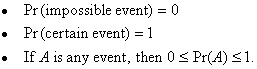
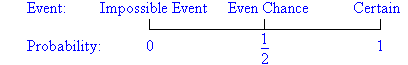
Range of Probability
If an event is impossible, its probability is 0. If an
event is certain to occur, its probability is 1. The
probability of any other event is between these two values. That is:
Example 4
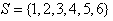
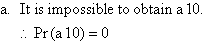
A die is rolled. Find the probability of obtaining:
a. a 10
b. a number less than or equal to 6
Solution:
Note:
- It is certain that event A will occur as it contains all 6
possible outcomes.
- 10 is not an outcome of rolling a die as it is not possible.
Key Terms
tree diagram, Venn diagram, graphical
representation, range of probability, impossible, certain |