In this section, we will consider the stemplot (or stem-and-leaf plot) which can be used to arrange, analyse and
interpret numerical data.
Stemplots (Stem-and-Leaf Plot)
A stemplot is a device used to group a small data set (up to
about 50 data values). It arranges the data set in ascending order
while retaining all the original data values. This enables us to
find the first quartile, median and the third quartile readily. The
stemplot is useful to obtain information about the centre, spread, shape
and outliers of the distribution.
Constructing a Stemplot
In a stemplot (i.e. stem-and-leaf plot), each data value is considered
to have two parts, a stem and a leaf. The leading
digit(s) of a data value form the stem, and the trailing digit(s) becomes
the leaf.
Three examples of a stemplot follow:
- Data values 64, 69 and 73 are recorded as shown below:
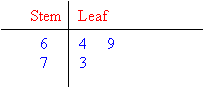
Note that 6 | 4 represents the data value 64.
- Data values 348, 365 and 479 are recorded as shown below:
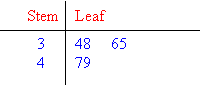
Note that 3 | 48 represents the data value 348.
- Data values 34.8, 35.2 and 35.9 are recorded as shown below:
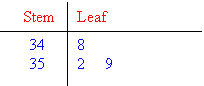
Note that 34 | 8 represents the data value 34.8.
Note:
To construct a stemplot, we:
- enter the stems to the left of a vertical dividing line and the leaf to the right of the vertical dividing line for each data value;
- record each data value as listed in the data set to construct an
unordered stemplot. Then we construct an ordered stemplot from
the unordered version by arranging the leaves in ascending order.
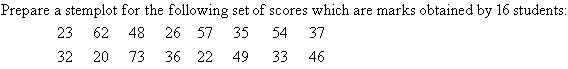
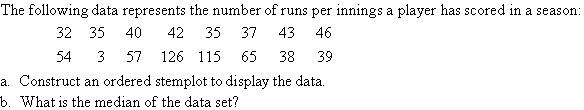
Example 5
Solution:
Lowest score = 20
Highest score = 73
A stemplot for the scores that range from 20 to 73 is as follows:
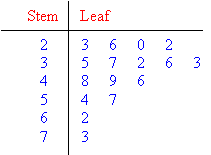
This stemplot is not ordered.
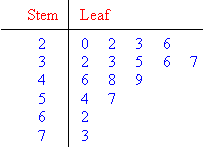
An ordered stemplot is obtained by arranging the leaves in order, as
shown below.
Note:
For each value of the data, the stem is the tens digit and the leaf is the units digit.
Example 6
Solution:
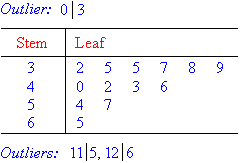
a. Lowest score = 3
Highest score = 126
An ordered stemplot for the scores that range from 3 to 126 is given
below. Stems 0, 1, 2, 3, 4, 5, 6, 7, 8 and 9 are formed by the tens
digits; whereas, the stems 10, 11 and 12 are formed by the hundreds and
tens digits. The leaves are formed by the unit digits of the scores.
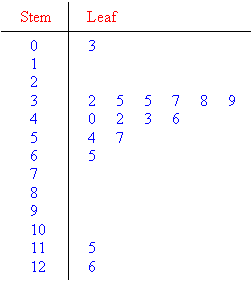
We notice that the scores 3, 115 and 126 are separated
from the main body of the data. So, 3, 115 and 126 are outliers.
The stemplot for the data consisting of outliers can be displayed as
follows:
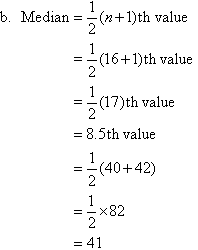
So, the median of the data set is 41.
Note:
The score of 3 is listed at the top of the table as an
outlier and the scores of 115 and 126 are listed below the table as
outliers.
Key Terms
stemplot, stem-and-leaf plot, stem, leaf, outlier |