| A line of best fit is drawn through a scatterplot to find the
direction of an association between two variables. This line of best fit
can then be used to make predictions.
To draw a line of best fit, balance the number of points above the line
with the number of points below the line.
Example 13
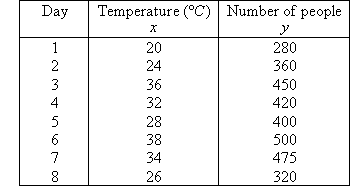
The following table describes data for the number of people using a
swimming pool over 8 days in summer and the corresponding maximum
temperature (in degrees Celsius) on each day.
a. Draw a scatterplot for this set of data.
b. Draw a line of best fit through the data by eye.
c. Is association positive or negative?
d. Is association weak or strong?
e. Use the line of best fit to predict the swimming pool attendance
where the daily maximum temperature is:
(i) 18 ºC
(ii) 30
ºC
(iii) 40 ºC
Solution:
a. The scatterplot is obtained by plotting y against x,
as shown below.
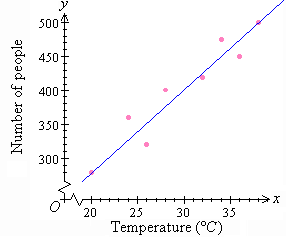
b. A line of best fit by eye is drawn through the scatterplot so
that an equal number of points lie on either side of the line and/or the
sum of the distances of the points above the line are roughly equal to the
sum of the distances below the line.
c. It is clear that y increases as x increases. So,
the association between the variables is positive.
d. The data is spread about the line. So, the association between
the variables is weak.
e.
(i) When x = 18, y = 260
So, about 260 people are expected to attend the
swimming pool.
(ii) When x = 30, y = 400
So, about 400 people are expected to attend
the swimming pool.
(iii) When x = 40, y = 520
So, about 520 people are expected to
attend the swimming pool.
Key Terms
line of best fit |